India – China Free Trade Agreement (FTA): Viability, Prospects and Challenges
Faculty Contributor : Rupa Chanda, Professor
Student Contributors : A V Naga Chaitanya, Pulkit Singhal
Despite the tremendous economic growth of both India and China, there is no FTA between these two countries. This article analyses the viability of a FTA in goods between India and China. An analysis based on revealed comparative advantage (RCA) and trade intensity (TI) measures is used to identify product groups, in which India and China stand to gain the most from reduction in tariff levels. Scenario analysis is performed to estimate the change in bilateral trade flows under two different tariff regimes. The article concludes that, from an Indian perspective, a narrow FTA covering only goods trade will not be beneficial to India. The viability of a FTA will hinge upon the non-goods components such as services, investments, collaboration in research and development etc.
India and China have come to play an increasingly dominant role in world economic affairs. Both nations have posted aggressive growth rates and, amongst other things. China in particular, has gained a large footprint in international trade and investment flows. Today, it is the world’s largest exporting nation1 while India’s exports have grown four fold over the period of 2001-20092.
In the recent past both China and India have been pursuing FTAs with a variety of countries particularly in Asia. However, no progress has been made towards the signing of a FTA between India and China - two of the largest and fastest growing economies of Asia. In fact, India’s domestic industry has sounded notes of caution on several occasions over a possible FTA with China3. In the context it is important to analyse, and if possible quantify, the potential affects of a FTA with China on India and to identify the specific areas wherein, a reduction of trade barriers could result in mutual benefit.
International Trade of India and China
International trade of both India and China has witnessed brisk growth in recent years. However, Exhibit 1 shows how China trades as much as 5 times more than what India does. In addition, China has emerged as an exports-driven economy with its growth rate of exports surpassing that of its imports. India’s export growth rate is still lagging behind its import growth rates.
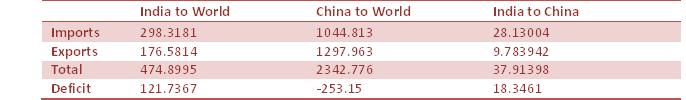 Exhibit 1 Trade Flows (in billion USD), 20084
According to Kowalski5, more than 50% of China’s exports come from final processing and assembly of intermediate goods imported from its Asian neighbours. On the other hand, India’s exports are primarily raw material and labour oriented with items such as mineral fuels and precious stones dominating the export basket.
Indo-China Bilateral Trade
India-China trade has a marked imbalance with India importing three times as much as it exports to China. Growth in bilateral trade (see Exhibit 2) has been rapid (CAGR of 30% for the period 1996-2008). China’s exports to India have been growing at a greater rate than overall Chinese exports as well as overall Indian imports. In other words, China is making inroads in to the Indian market at a much quicker pace than in any of its other export destinations. It is also faster than the average exporter to India in grabbing market share in India.
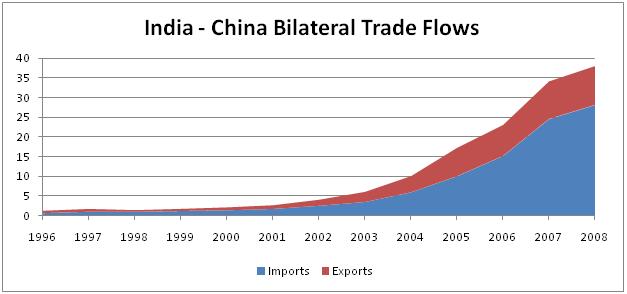 Exhibit 2 India-China Bilateral Trade Flows
Analysis of Export Competitiveness
We used two popular measures of competitiveness – (i) Balassa’s Revealed Comparative Advantage (RCA)6 and (ii) Trade Intensity to identify those product groups in which Indo-China bilateral trade is not in-line with India’s and China’s overall trade in that product group. Such deviations could be due to tariff or non-tariff barriers, which a FTA could address. We conducted this analysis at the 2-digit level of harmonised system (HS) codes.
Balassa’s Revealed Comparative Advantage
RCA is a measure of a country’s export competitiveness in a particular commodity category in the international market for that commodity. RCA is the ratio of a country’s share of exports in world exports in a particular category to its share of exports in overall world exports. An RCA of greater than 1 indicates high competitiveness. RCA for ith country under kth commodity category RCAik is:
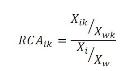
Xik: Country i’s exports in category k
Xwk: World exports in category k
Xi: Country i’s total exports
Xw: Total exports of the world
We computed RCA for India and China under each of the product categories.
Trade Intensity
Trade Intensity (TI) is a measure of a country’s export competitiveness in a specific partner’s market. Like RCA, it uses a country’s current trade flows to measure its competitiveness. We calculated category wise trade intensity for India-China trade flows. Trade Intensity of ith country with respect to the jth country under kth commodity category, Tijk is given by
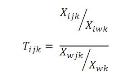
Xijk: Country i’s exports to country j in category k
Xiwk: Country i’s exports to the world in category k
Xwjk: World’s exports to country j in category k
Xwk: Total world exports in category k
We calculated India’s trade intensity in the Chinese market for each commodity and China’s trade intensity in the Indian market for each commodity. A TI value of greater than 1 is interpreted as high competitiveness.
Trade Intensity to Revealed Comparative Advantage Ratio
TI of a country in a particular commodity measures the country’s export competitiveness in a specific partner’s market while RCA measure’s country’s export competitiveness in all international markets. Hence, one could, by tracking for a given commodity, India’s TI in the Chinese market and India’s RCA identify any loss in India’s export competitiveness in the Chinese market.
To identify such unfavourable deviations from normal competitiveness we computed the TI to RCA ratio of India and China in each of the 2-digit HS code product groups for the period 2001-2008. If the TI to RCA ratio is less than one then for commodity k, country i is not as competitive in the market of country j as it is in the world market.
Using this ratio we identified commodity categories which exhibited a dropping TI to RCA ratio over the years or had a TI to RCA ratio which was consistently below 1. We shortlisted the commodity categories (at the HS 2-digit level) as shown in Exhibit 3.
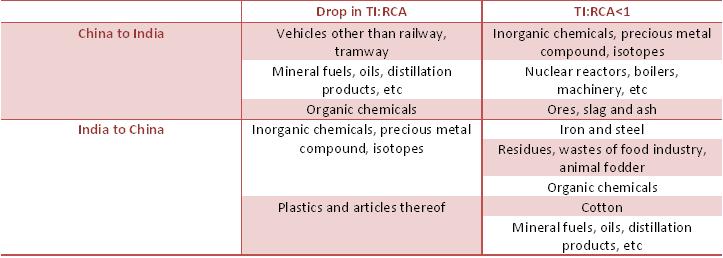 Exhibit 3 Product Groups with Weak TI to RCA Ratio
Underperforming Product Groups
In those categories where China was not competitive (as identified by the TI:RCA ratio) in the Indian market, we identified other exporting countries who were the main competitors to China. We ranked these competing countries as per their contributions to the incremental imports to India during the period 2001-2008. We then ranked China and its competitors in the Indian market as per their respective RCAs in that product category. We conducted a similar analysis for India.
As an example, consider organic chemicals which rank third (as per dollar value) in India’s exports to China. In this product category, India ranks 10th amongst all exporters to China. However, in terms of RCA, it is more competitive than 3 of the 9 ranked above it. This indicates that there may be unachieved potential in this particular area to push India’s exports to China. Exhibit 4 tabulates our findings.
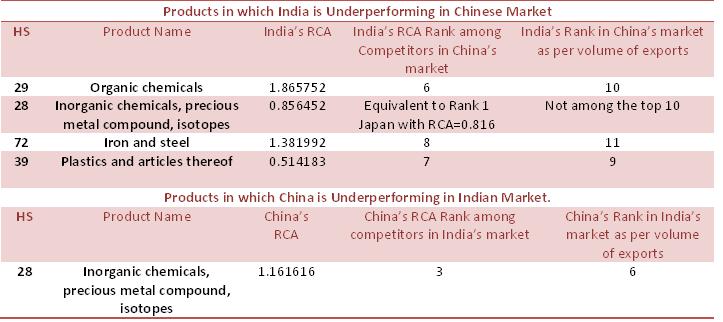 Exhibit 4 Underperforming Product Groups
Scenario Analysis
In this section, we describe our analysis of sensitivity of Indo-China trade flows to a potential FTA. We have used import elasticities of product groups at the level of 6-digit HS codes for conducting this analysis.
Import Elasticities
We used Import elasticities computed by Keey, Nicitaz and Marcelo Olarreag7 at the HS 6-digit code level. The import elasticity of a product category is the percentage increase in the quantity of an import in to a country, in response to a 1% decrease in import prices. Hence, given the import elasticity of a product and its price per unit quantity, one can estimate the increase in dollar value of imports for a given decrease in tariffs.
Bilateral Trade Data
India’s exports to and imports from China (both in dollar terms as well as quantity terms) in 2008 was used as the default scenario, collected at the 6-digit HS code level8. During our analysis, we assumed that neither country would agree to the other party increasing its tariff rate beyond the current applied tariff rates to the most favoured nations>9. In other words, the applied tariffs were the upper caps on the simulated tariffs in our analysis.
Sensitive lists for India and China
For the purposes of our analysis, we assumed that India and China would be maintaining the very same sensitive lists that they used in their recent FTAs with ASEAN for their FTA with each other. We then computed new trade flows for the following two hypothetical scenarios.
Scenario 1: China opens up its markets to India
In this scenario, we assumed that China reduces tariffs on all items, which do not appear on its negative or sensitive lists to zero, while India continues to use the current applied rates for China. Our results indicate that even in a scenario where China completely opens up its markets, while India does not, India will continue to have a deficit. In fact, the deficit only reduces from $22.1 billion to $21.4 billion. Our exports register an increase of 8.6%, which is not enough to make a dent in the deficit.
Scenario 2: Both India and China open up their economies to each other
In this scenario, we assume that both China and India agree to open up their economies completely to each other. However, in the case of sensitive list items, tariff rates will be brought down to 5% and in the case of negative list items, current applied tariff rates will be continued. Overall, bilateral trade grows by 15% from about $40 billion to $46 billion. However, India’s trade deficit goes up by 18.18% to $26 billion. Exhibit 5 shows the results.
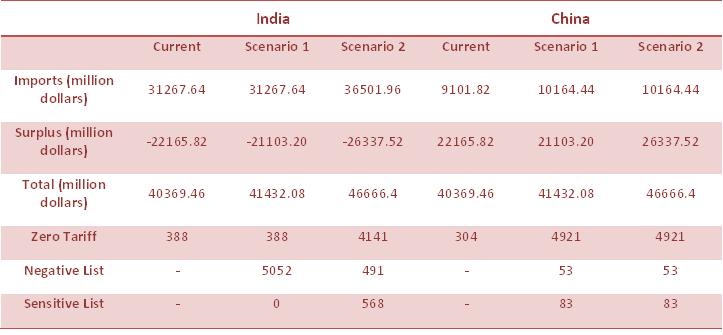 Exhibit 5 Scenario Analysis10
Our findings suggest that India is just not competitive enough in goods to the extent that even a completely biased FTA fails to make a substantial dent in India’s deficit. Apart from differences in manufacturing sector prowess, we identified two other reasons for this. Firstly, China’s tariff rates are already low and a FTA in goods will not significantly boost exports to China. Secondly, about 45% (in 2008) of India’s exports to China fall under the category of “non-agglomerated iron ores and concentrates (excl. roasted iron pyrites)” on which China already has a tariff rate of zero. In other words, about 45% of India’s exports to China will remain unaffected by a FTA with China.
India should aim towards building a more diversified trade basket. It should gradually move away from resource and labour intensive goods and move towards more value added product categories. This would require making significant strides in the manufacturing sector. Therefore, a FTA with China should incorporate phased reduction of tariff barriers to give Indian industry the time to adjust and improve. Our results also suggest that India should pursue a broader mandate for negotiations going beyond goods so that India can trade off the concessions made against gains in other areas, for instance, services in which India is more competitive than China.
Conclusion
Our analysis shows that a narrow goods based FTA will be heavily in favour of China and is unlikely to be accepted by Indian industry. Any bilateral agreement between the two countries needs to be comprehensive and overarching, encompassing not just goods but also services, investment, collaboration in research and development and must be backed by frameworks on issues such as antidumping, standards, and dispute resolution. Only then can India stand to gain from a bilateral accord with China. Hence, our work suggests a need for an exhaustive study to assess how India and China can engage each other in these other areas, specifically in services trade, cross border investments, and research and development efforts, before India pursues a FTA with China. Finally, one must not ignore the role of trade and commerce in moderating bilateral relationships. A FTA with China may have benefits that escape quantification and transcend economics.
Keywords
Economics, Bilateral Trade, Free Trade Agreement, Relative Comparative Advantage, Trade Intensity, Import Elasticity, India-China Trade
Contributors
Rupa Chanda is a Professor in the Economics & Social Sciences Area at IIM Bangalore. She holds a PhD in Economics from Columbia University and a BA in Economics from Harvard University. She can be reached at rupa@iimb.ernet.in
A V Naga Chaitanya (PGP 2009-11) holds a Bachelor’s degree in Electrical engineering from Indian Institute of Technology, Delhi and can be reached at chaitanya.a09@iimb.ernet.in@iimb.ernet.in
Pulkit Singhal (PGP 2009-11) holds a Bachelor’s degree in Electrical engineering from Indian Institute of Technology, Madras and can be reached at pulkit.singhal09@iimb.ernet.in
References
- The World Fact Book, “Country Comparison: Exports”, https://www.cia.gov/library/publications/the-world-factbook/rankorder/2078rank.html, last accessed on Sept 24, 2010
- ITC Trade Map, “Trade statistics for international business development”, http://www.trademap.org, last accessed on Sept 24, 2010
- Bilateral.org, “Cautious approach needed on FTA with China: Assocham”, Apr 5 2008, http://www.bilaterals.org/spip.php?article11731, last accessed on Sept 24 2010
- Exhibits 1-5, International Merchandise Trade Statistics, http://comtrade.un.org/ last accessed on Jul 8 2010
- Kowalski, P, 2008, “China and India: A Tale of Two Trade Integration Approaches”, Working Paper No. 221, Indian Council for Research on International Economic Relations, India
- Balassa, B. (1965), “Trade Liberalisation and Revealed Comparative Advantage”, The Manchester School, 33, 99-123
- Hiau Looi Keey, Alessandro Nicitaz, Marcelo Olarreaga, World Trade Organization, Import Demand Elasticities and Trade Distortions, http://siteresources.worldbank.org/INTRES/Resources/4692321107449512766/Restat_MS10322_accepted.pdf, last accessed on 13th August 2010
- Ministry of Commerce, India, Export Import data bank, http://commerce.nic.in/eidb/default.asp , last accessed on 13th August 2010
- World Trade Organization, Tariff Download Facility, http://tariffdata.wto.org/ReportersAndProducts.aspx , last accessed on 13th August 2010
- Calculated Based on data from http://commerce.nic.in/eidb/default.asp, http://tariffdata.wto.org/ReportersAndProducts.aspx, http://siteresources.worldbank.org, last accessed on 13th Aug 2010
